Examples
As described in Quick Start, the five logos shown in Figure 1 of Tareen and Kinney (2019) [1] can be generated using the function logomaker.demo. Here we describe each of these logos, as well as the snippets of code used to generate them. All snippets shown below are designed for use within a Jupyter Notebook, and assume that the following header cell has already been run.
# standard imports
import numpy as np
import pandas as pd
import matplotlib.pyplot as plt

# displays logos inline within the notebook;
# remove if using a python interpreter instead
%matplotlib inline

# logomaker import
import logomaker
CRP energy logo
The following code creates an energy logo for the E. coli transcription factor CRP. The energy matrix illustrated by this logo was reported by Kinney et. al. (2010) [2] based on the analysis of data from a massively parallel reporter assay. This energy matrix is included with Logomaker as example data, and is loaded here by calling logomaker.get_example_matrix with the argument 'crp_energy_matrix'. A Logo object named crp_logo is then created using the styling parameters shade_below, fade_below, and font_name. Subsequent styling is then performed using the Logo object methods style_spines and style_xticks. Additional styling is also performed using methods of crp_logo.ax, the matplotlib Axes object on which the logo is drawn.
# load crp energy matrix
crp_df = -logomaker.get_example_matrix('crp_energy_matrix',
                                        print_description=False)

# create Logo object
crp_logo = logomaker.Logo(crp_df,
                          shade_below=.5,
                          fade_below=.5,
                          font_name='Arial Rounded MT Bold')

# style using Logo methods
crp_logo.style_spines(visible=False)
crp_logo.style_spines(spines=['left', 'bottom'], visible=True)
crp_logo.style_xticks(rotation=90, fmt='%d', anchor=0)

# style using Axes methods
crp_logo.ax.set_ylabel("$-\Delta \Delta G$ (kcal/mol)", labelpad=-1)
crp_logo.ax.xaxis.set_ticks_position('none')
crp_logo.ax.xaxis.set_tick_params(pad=-1)
Splice site probability logo
The following code creates a probability logo derived from all 5’ splice sites annotated in the human genome [3]. Here the probability of each RNA nucleotide at each position is indicated by both character height and character opacity. The dashed line indicates the intron/exon boundary, with exonic sequence on the left and intronic sequence on the right. This probability matrix is included with Logomaker as example data, and is loaded into a pandas DataFrame object named ss_df by calling logomaker.get_example_matrix with the argument 'ss_probability_matrix'. A Logo object named ss_logo is then created using the styling parameters width, vpad, fade_probabilities, stack_order, color_scheme, and font_name. Subsequent styling is performed using the Logo object method style_spines, as well as multiple Axes object methods.
# load ss probability matrix
ss_df = logomaker.get_example_matrix('ss_probability_matrix',
                                     print_description=False)

# create Logo object
ss_logo = logomaker.Logo(ss_df,
                         width=.8,
                         vpad=.05,
                         fade_probabilities=True,
                         stack_order='small_on_top',
                         color_scheme='dodgerblue',
                         font_name='Rosewood Std')

# style using Logo methods
ss_logo.style_spines(spines=['left', 'right'], visible=False)

# style using Axes methods
ss_logo.ax.set_xticks(range(len(ss_df)))
ss_logo.ax.set_xticklabels('%+d'%x for x in [-3, -2, -1, 1, 2, 3, 4, 5, 6])
ss_logo.ax.set_yticks([0, .5, 1])
ss_logo.ax.axvline(2.5, color='k', linewidth=1, linestyle=':')
ss_logo.ax.set_ylabel('probability')
WW domain information logo
The following code creates an information logo derived from a multiple sequence alignment (obtained from PFam [4]) of protein WW domains. Here the height of each stack of characters indicates information content, as described by Schneider and Stevens (1990) [5]. First, the information matrix is loaded into ww_df by calling logomaker.get_example_matrix with the argument 'ww_information_matrix'. A Logo object named ww_logo is then generated. Among other styling options, setting the color_scheme parameter to 'NajafabadiEtAl2017' causes Logomaker to use a color scheme extracted from Najafabadi et al. (2017) [6]; the list of all available color schemes can be viewed by calling logomaker.list_color_schemes(). The Logo object method highlight_position is also used to highlight the two eponymous positions of the WW domain.
# load ww information matrix
ww_df = logomaker.get_example_matrix('ww_information_matrix',
                                     print_description=False)

# create Logo object
ww_logo = logomaker.Logo(ww_df,
                         font_name='Stencil Std',
                         color_scheme='NajafabadiEtAl2017',
                         vpad=.1,
                         width=.8)

# style using Logo methods
ww_logo.style_xticks(anchor=0, spacing=5, rotation=45)
ww_logo.highlight_position(p=4, color='gold', alpha=.5)
ww_logo.highlight_position(p=26, color='gold', alpha=.5)

# style using Axes methods
ww_logo.ax.set_ylabel('information (bits)')
ww_logo.ax.set_xlim([-1, len(ww_df)])
ARS enrichment logo
The following code creates an enrichment logo that illustrates the results of a mutARS-seq experiment (unpublished; performed by JBK) analogous to the one reported by Liachko et al. (2013) [7]. In this logo, the height of each character indicates the log-fold enrichment observed in a plasmid selection experiment performed on a large library of mutated ARS1 origins of replication. First, the enrichment matrix is loaded into ars_df by calling logomaker.get_example_matrix with the argument 'ars_enrichment_matrix'. Next, we call logomaker.open_example_datafile with argument 'ars_wt_sequence.txt'; this returns a file handle from which the wild-type ARS1 DNA sequence is parsed. Both the enrichment matrix and the ARS1 sequence are then trimmed. Next, a Logo object named ars_logo is created with all characters colored 'dimgray'. The wild-type ARS1 sequence is then colored in orange by calling ars_logo.style_glyphs_in_sequence with the argument color set to 'darkorange'. Three functional elements within ARS1 (termed A, B1, and B2, from left to right) are then highlighted using ars_logo.highlight_position_range. Some additional Axes styling is then performed.
# load ARS enrichment matrix
ars_df = logomaker.get_example_matrix('ars_enrichment_matrix',
                                      print_description=False)

# load wild-type ARS1 sequence
with logomaker.open_example_datafile('ars_wt_sequence.txt',
                                     print_description=False) as f:
    lines = f.readlines()
    lines = [l.strip() for l in lines if '#' not in l]
    ars_seq = ''.join(lines)

# trim matrix and sequence
start = 10
stop = 100
ars_df = ars_df.iloc[start:stop, :]
ars_df.reset_index(inplace=True, drop=True)
ars_seq = ars_seq[start:stop]

# create Logo object
ars_logo = logomaker.Logo(ars_df,
                          color_scheme='dimgray',
                          font_name='Luxi Mono')

# color wild-type ARS1 sequence within logo
ars_logo.style_glyphs_in_sequence(sequence=ars_seq, color='darkorange')

# highlight functional regions of ARS1
ars_logo.highlight_position_range(pmin=7, pmax=22, color='lightcyan')
ars_logo.highlight_position_range(pmin=33, pmax=40, color='honeydew')
ars_logo.highlight_position_range(pmin=64, pmax=81, color='lavenderblush')

# additional styling using Logo methods
ars_logo.style_spines(visible=False)

# style using Axes methods
ars_logo.ax.set_ylim([-4, 4])
ars_logo.ax.set_ylabel('$\log_2$ enrichment', labelpad=0)
ars_logo.ax.set_yticks([-4, -2, 0, 2, 4])
ars_logo.ax.set_xticks([])
Neural network saliency logo
Saliency logos provide a useful way to visualize the features (within a specific biological sequence) that a deep neural network model deems to be important. Saliency logos differ from more standard logos in that only one character is drawn at each position. Below we reproduce (with permission) the saliency logo from Figure 1D of Jaganathan et al. (2019) [8], which illustrates sequence features important for the proper splicing of U2SUR exon 9. First, the saliency matrix is loaded into nn_df by calling logomaker.get_example_matrix with the argument 'nn_saliency_matrix'. Next, a Logo object named nn_logo is created and its methods are used to style the Axes spines. More axes styling is then carried out using native Axes methods. Finally, a gene body diagram with annotations is drawn below the logo.
# load saliency matrix
nn_df = logomaker.get_example_matrix('nn_saliency_matrix',
                                     print_description=False)

# create Logo object
nn_logo = logomaker.Logo(nn_df)

# style using Logo methods
nn_logo.style_spines(visible=False)
nn_logo.style_spines(spines=['left'], visible=True, bounds=[0, .75])

# style using Axes methods
nn_logo.ax.set_xlim([20, 115])
nn_logo.ax.set_xticks([])
nn_logo.ax.set_ylim([-.6, .75])
nn_logo.ax.set_yticks([0, .75])
nn_logo.ax.set_yticklabels(['0', '0.75'])
nn_logo.ax.set_ylabel('                 saliency', labelpad=-1)

# set parameters for drawing gene
exon_start = 55-.5
exon_stop = 90+.5
y = -.2
xs = np.arange(-3, len(nn_df),10)
ys = y*np.ones(len(xs))

# draw gene
nn_logo.ax.axhline(y, color='k', linewidth=1)
nn_logo.ax.plot(xs, ys, marker='4', linewidth=0, markersize=7, color='k')
nn_logo.ax.plot([exon_start, exon_stop],
                [y, y], color='k', linewidth=10, solid_capstyle='butt')

# annotate gene
nn_logo.ax.plot(exon_start, 1.8*y, '^k', markersize=15)
nn_logo.ax.text(20,2*y,'$U2SURP$',fontsize=12)
nn_logo.ax.text(exon_start, 2.5*y,'chr3:142,740,192', verticalalignment='top', horizontalalignment='center')
Logomaker logo
Below is the code used to make the Logomaker logo. First, Figure and Axes objects of the desired size are created. The data matrix for the logo is then loaded into logo_df. Next, a custom color scheme is defined in the form of a dict object. A Logo object is then created using a variety of optional arguments that, among other things, specify the Axes and color scheme to use. Subsequently, the second ‘O’ in ‘LOGO’ is recolored, after which the characters in ‘marker’ are flipped right-side up, rendered in font 'ORC A Std', and widened slightly. Finally, tick marks are removed and the Axes is rescaled to fill the Figure.
# make Figure and Axes objects
fig, ax = plt.subplots(1,1,figsize=[4,2])

# load logo matrix
logo_df = logomaker.get_example_matrix('logomaker_logo_matrix',
                                       print_description=False)

# create color scheme
color_scheme = {
    'L' : [0, .5, 0],
    'O' : [1, 0, 0],
    'G' : [1, .65, 0],
    'maker': 'gray'
}

# create Logo object
logo_logo = logomaker.Logo(logo_df,
                           ax=ax,
                           color_scheme=color_scheme,
                           baseline_width=0,
                           font_name='Arial',
                           show_spines=False,
                           vsep=.005,
                           width=.95)

# color the 'O' at the end of the logo a different color
logo_logo.style_single_glyph(c='O', p=3, color=[0, 0, 1])

# change the font of 'maker' and flip characters upright.
logo_logo.style_glyphs_below(font_name='OCR A Std', flip=False, width=1.0)

# remove tick marks
ax.set_xticks([])
ax.set_yticks([])

# tighten layout
logo_logo.fig.tight_layout()
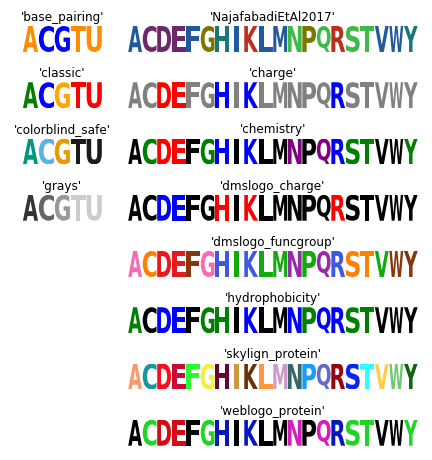
Color schemes
The following code creates a figure that illustrates all of Logomaker’s built-in color schemes. To use one of these color schemes, set the color_scheme parameter to the indicated color scheme name when creating a Logo object.
# get data frame of all color schemes
all_df = logomaker.list_color_schemes()

# set the two types of character sets
char_sets = ['ACGTU', 'ACDEFGHIKLMNPQRSTVWY']
colspans = [1, 3]
num_cols = sum(colspans)

# compute the number of rows
num_rows_per_set = []
for char_set in char_sets:
    num_rows_per_set.append((all_df['characters'] == char_set).sum())
num_rows = max(num_rows_per_set)

# create figure
height_per_row = .8
width_per_col = 1.5
fig = plt.figure(figsize=[width_per_col * num_cols, height_per_row * num_rows])

# for each character set
for j, char_set in enumerate(char_sets):

    # get color schemes for that character set only
    df = all_df[all_df['characters'] == char_set].copy()
    df.sort_values(by='color_scheme', inplace=True)
    df.reset_index(inplace=True, drop=True)

    # for each color scheme
    for row_num, row in df.iterrows():
        # set axes
        col_num = sum(colspans[:j])
        col_span = colspans[j]
        ax = plt.subplot2grid((num_rows, num_cols), (row_num, col_num),
                              colspan=col_span)

        # get color scheme
        color_scheme = row['color_scheme']

        # make matrix for character set
        mat_df = logomaker.sequence_to_matrix(char_set)

        # make and style logo
        logomaker.Logo(mat_df,
                       ax=ax,
                       color_scheme=color_scheme,
                       show_spines=False)
        ax.set_xticks([])
        ax.set_yticks([])
        ax.set_title(repr(color_scheme))

# style and save figure
fig.tight_layout()